What Is AI Agent Observability and Why Do AI Agents Need Monitoring?
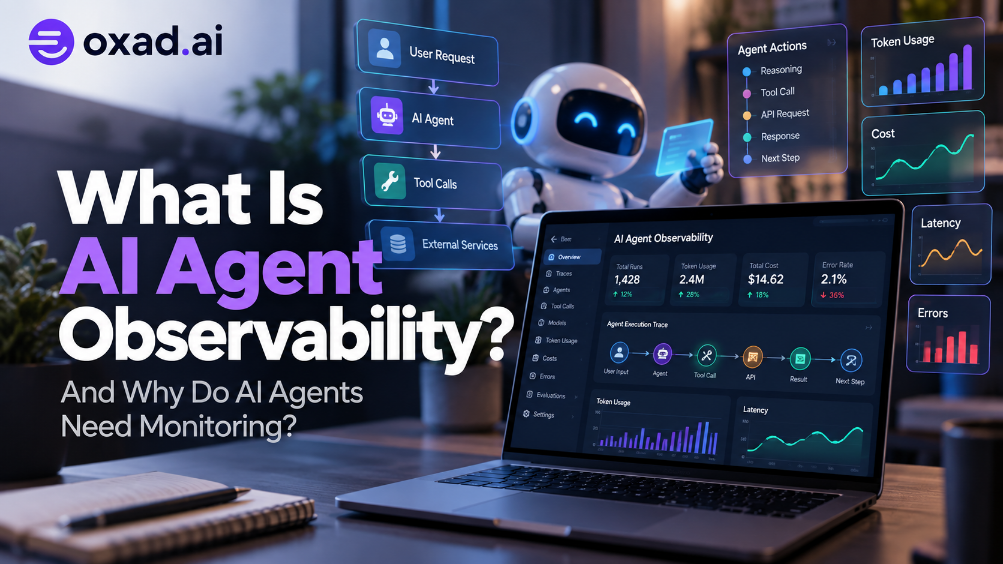
AI agents are becoming more autonomous, but autonomy creates a new operational problem: how do you know what an agent actually did? AI agent observability gives developers visibility into decisions, model calls, tool usage, latency, tokens, errors, state changes, and final outcomes.
Traditional AI applications can often be understood by looking at a prompt, a model call, and a response. An AI agent is different. It may reason through several steps, select tools, call APIs, browse the web, execute code, retrieve information, change state, retry failed actions, and make another decision before producing a final result.
That makes monitoring an agent much more than checking whether the final answer looks correct.
In 2026, observability is becoming an important part of the agent stack. IBM watsonx Orchestrate provides agent analytics and execution-trace debugging, Datadog offers Agent Observability for traces, costs, tokens, latency and errors, and Splunk has expanded Agent Observability around tracing, evaluation, token economics and guardrails.
What Is AI Agent Observability?
AI agent observability is the practice of collecting and analyzing telemetry from an AI agent so developers can understand what the agent did, why it did it, how it performed, what it cost, and what happened as a result.
It extends traditional observability concepts such as logs, metrics, and traces into an agentic environment where decisions, model calls, tool invocations, retrieval steps, and outcomes all matter.
IBM describes agent observability as understanding the end-to-end behavior of an agentic ecosystem, including interactions with models and external tools.
Observe → Understand → Evaluate → Improve
Trace the agent’s trajectory, identify the problem, measure its impact, then improve the workflow.
Why Do AI Agents Need Observability?
The more autonomous an agent becomes, the harder it is to understand its behavior from the final response alone.
Imagine an agent asked to research a company and prepare a report. It might:
Call a search tool.
Open several web pages.
Extract information.
Call another model to summarize it.
Query a database.
Retry an unsuccessful tool call.
Change its plan.
Generate a report.
If the final report is wrong, simply looking at the answer does not tell you where the failure occurred.
The problem could have started with a bad search result, an incorrect tool choice, a failed API call, excessive retries, a model routing decision, stale context, or an error several steps earlier.
Observability connects these events into a trace so developers can investigate the complete trajectory.
How Is AI Agent Observability Different From LLM Observability?
LLM observability usually focuses on individual model interactions: prompts, responses, latency, tokens, model selection, and errors.
Agent observability has to follow the larger workflow around those model calls.
LLM Observability
AI Agent Observability
Prompt and response
Complete agent trajectory
Model latency
End-to-end workflow latency
Token usage
Token usage across models, tools and steps
Model errors
Model, tool, API and workflow errors
Single inference
Multiple decisions and actions
Output quality
Outcome quality and task completion
Model behavior
Agent behavior and tool behavior
This does not mean LLM observability becomes irrelevant. Instead, LLM telemetry becomes one layer inside a larger agent observability system.
What Does an AI Agent Trace Look Like?
A conventional application might look like this:
User → Application → LLM → Response
An autonomous agent can look more like this:
User
↓
AI Agent
↓
Plan / Decision
↓
Model Call → Tool Selection → API / Browser / Code
↓
Tool Result
↓
New Decision
↓
Another Tool or Model
↓
Final Action → Outcome
Agent observability therefore needs to preserve relationships between events rather than treating every model call as an isolated log entry.
What Should You Monitor in an AI Agent?
What to Monitor
Why It Matters
Agent decisions
Understand why an action happened.
Tool calls
Detect incorrect, unnecessary, or repeated tool usage.
Model calls
See which models are being used and where.
Token usage
Control rapidly growing inference costs.
Latency
Find slow models, tools, or workflow steps.
Errors
Identify failed model, API, and tool operations.
Retries
Detect loops and inefficient recovery behavior.
Agent trajectory
Understand the complete workflow from request to outcome.
State changes
See what the agent actually changed.
Human interventions
Measure where autonomous execution requires approval.
Security events
Detect suspicious or policy-violating behavior.
Final outcomes
Determine whether the task actually succeeded.
How Do You Monitor AI Agent Costs?
Agent costs can be harder to understand than the price of one LLM request because a single task may generate many model calls and tool operations.
For example, an agent might start with a cheap model, call a stronger model for a difficult decision, retrieve documents, retry a tool, and then generate a final response. Looking only at the final model call would hide most of the cost.
Good agent observability should therefore let teams answer:
How many tokens did this task consume?
Which model consumed the most tokens?
Which tool or workflow step caused the extra calls?
How much did retries add to the cost?
Which types of tasks are the most expensive?
Does higher cost actually produce a better outcome?
Splunk explicitly connects agent tracing with token economics and infrastructure signals, while Datadog exposes token usage, costs, latency and errors as part of its Agent Observability offering.
What Is Agent Trajectory Observability?
An agent trajectory is the sequence of decisions and actions an agent takes while attempting to complete a task.
Trajectory observability means preserving that sequence so developers can reconstruct what happened.
This is especially important when an agent succeeds for the wrong reason, fails only occasionally, or behaves differently after a model or tool is changed.
Instead of asking only, “What answer did the agent produce?”, developers can ask:
What did the agent see? What did it decide? Which tool did it call? What result did it receive? Why did it continue? What did it finally change?
Trace → Evaluate → Profile → Control
Observability becomes more useful when it is treated as an operational loop rather than a dashboard.
Stage
Purpose
Trace
Capture the agent’s actions and dependencies.
Evaluate
Measure quality, reliability, safety and task success.
Profile
Find recurring resource and performance hotspots across many runs.
Control
Apply limits, approvals, policies and runtime guardrails.
This model is becoming particularly interesting for long-running agents. A recent research project, AgentPProf, argues that debugging individual executions is not enough and proposes semantic profiling across agent trajectories to identify where tasks consume resources and where problems occur.
Why Is Agent Profiling Different From Debugging?
Debugging usually asks why one execution failed.
Profiling asks a broader question: where does the agent repeatedly spend time, tokens, or resources across many executions?
AgentPProf applies this idea to long-horizon agents and produces profiles that can visualize token consumption and other activity across semantic operations.
This could become increasingly important as agents move from short chat interactions toward long-running coding, research, operations, and business workflows.
How Does Agent Observability Help AI Coding Agents?
Coding agents are a particularly useful example because they can make many actions during one task: inspect files, search code, run commands, edit files, execute tests, inspect errors, and retry.
Microsoft’s current observability guidance for AI coding agents highlights dashboards for cost, token consumption, sessions, model usage, tool invocations, latency and errors across agents such as Copilot, Claude Code, Codex, OpenClaw and OpenCode.
That means developers can investigate not only whether a coding task succeeded, but also which tools were used, how much the task cost, where it became slow, and where approvals or sandbox activity occurred.
This fits naturally with an AI agent harness, which provides the execution environment and controls around an agent.
How Does Observability Connect to AI Model Routing?
Observability can also reveal whether model selection is actually working as intended.
Suppose an agent uses a small model for simple decisions and a more capable model for complex tasks. Without telemetry, it may be difficult to know whether the routing strategy is reducing cost without damaging quality.
With observability, developers can compare model usage, latency, token consumption, error rates and task outcomes.
This creates a direct connection between AI model routing and agent observability: routing decides which model should handle a task, while observability shows whether that decision produced the expected result.
Is AI Agent Observability the Same as AI Agent Security?
No. They overlap, but they answer different questions.
Observability
Security
What did the agent do?
Was the action allowed?
Why did it happen?
Could the action cause harm?
How much did it cost?
Could credentials or data be exposed?
Where did the workflow fail?
Was the agent manipulated?
How can performance improve?
How can dangerous behavior be prevented?
Security can use observability data, but observability itself is broader. For the security side, see our guide to AI agent security.
The distinction is becoming more important as platforms combine monitoring with runtime controls. NVIDIA’s Open Agent Safety Platform, for example, combines OpenShell runtime boundaries with Sentry monitoring and enforcement designed to detect and contain agents that move outside defined boundaries.
What Are Companies Building for AI Agent Observability?
The market is moving from generic LLM logging toward agent-specific operational platforms.
IBM watsonx Orchestrate: provides agent analytics, conversation history, token and latency metrics, evaluation scores, and step-by-step execution trace debugging.
Datadog: traces LLM workflows and exposes tokens, latency, errors, costs and evaluations, with integrations for major AI frameworks.
OpenTelemetry-based stacks: provide a foundation for collecting traces and metrics across distributed agent systems. Splunk’s AI monitoring documentation, for example, uses OpenTelemetry instrumentation for agent telemetry.
The growing number of dedicated agent-observability products also suggests that the category is moving beyond an experimental developer concept toward a production requirement. Current 2026 tool comparisons already include dedicated platforms for tracing, evaluation, cost tracking and agent workflows.
What Happens When You Cannot Observe an AI Agent?
An unobservable agent can become a black box.
A developer may know that a task failed without knowing why. A team may see an unexpectedly large API bill without knowing which workflow generated it. A security team may detect suspicious behavior without being able to reconstruct the complete trajectory.
As agents become more autonomous, this lack of visibility becomes increasingly expensive.
More autonomy means more actions. More actions mean more telemetry is needed to understand what happened.
How Can Developers Build an AI Agent Observability Stack?
A practical stack does not need to begin with an enormous monitoring platform. The important thing is to capture the right signals consistently.
Instrument the agent: capture model calls, tools, retrieval, errors and important state transitions.
Create traces: group related events into a single task or agent trajectory.
Track cost: record tokens, model usage and other billable resources.
Measure outcomes: determine whether the task actually succeeded.
Add evaluations: measure quality, safety and reliability.
Profile recurring behavior: find expensive or slow patterns across many runs.
Add controls: use approvals, limits and guardrails where autonomy creates risk.
What Should You Monitor First?
If you are building your first production agent, start with a small set of high-value signals:
End-to-end task success rate.
Agent trajectory and tool calls.
Token usage and cost per task.
Latency by workflow step.
Error and retry rates.
Model selection.
Human approvals and interventions.
Important state changes.
Once these signals are reliable, more advanced evaluation, profiling, security monitoring and business metrics can be added.
AI Agent Observability Is Becoming an AgentOps Layer
The bigger trend is the emergence of an operational layer around AI agents.
Developers first needed frameworks to build agents. Then they needed tools, memory, model routing, sandboxes and security. Now they increasingly need a way to understand how those pieces behave after deployment.
That makes observability part of a broader AgentOps lifecycle:
IBM’s October 2026 watsonx Orchestrate updates are a good example of this shift, emphasizing visibility, governance and monitoring as organizations manage larger agent ecosystems.
Watch: What Does AI Agent Observability Look Like?
The following video provides a practical demonstration of monitoring a live AI agent, including traces, errors, latency, token usage, costs, evaluations and agent activity.
This demonstration is useful because it shows the difference between simply running an agent and being able to inspect what happened during its execution.
What Is the Future of AI Agent Observability?
The next generation of observability will likely move beyond dashboards that tell developers what happened after the fact.
Future systems can increasingly connect four capabilities:
Real-time tracing to understand what the agent is doing.
Evaluation to determine whether the behavior is good or bad.
Profiling to discover recurring resource and performance patterns.
Runtime control to stop, redirect or require approval for risky actions.
This is particularly important for always-on and long-running agents. When an agent can continue working for hours or days, traditional request-level monitoring is no longer enough.
Frequently Asked Questions
What is AI agent observability?
AI agent observability is the practice of monitoring and understanding an agent’s decisions, actions, performance, costs and outcomes.
How do you monitor AI agents?
Developers monitor agents by collecting traces, tool calls, model calls, tokens, latency, errors, state changes and outcomes.
What is the difference between LLM observability and agent observability?
LLM observability focuses on model interactions, while agent observability follows the complete multi-step agent workflow.
How do you trace AI agent actions?
Instrument the agent and connect model calls, tool calls, retrieval steps and results into a single execution trace.
How do you monitor AI agent costs?
Track tokens, model calls, retries and other resource usage for each agent task and workflow.
Why do AI agents need observability?
Agents can make many decisions and tool calls, making failures and unexpected costs difficult to diagnose without detailed traces.
Is AI agent observability the same as security?
No. Observability explains behavior, while security focuses on preventing unauthorized or harmful behavior.
What should you monitor in an AI agent?
Monitor decisions, tools, models, tokens, latency, errors, retries, state changes, interventions and final outcomes.
Can observability reduce AI agent costs?
Yes. Visibility can reveal expensive models, unnecessary retries, inefficient tools and workflows that consume excessive tokens.
What is agent trajectory?
An agent trajectory is the sequence of decisions, model calls, tool actions and results produced while completing a task.
Conclusion
AI agents are moving from simple demonstrations toward systems that can plan, use tools, modify data, write code and operate for longer periods. That makes understanding their behavior just as important as building their capabilities.
AI agent observability answers the operational question that increasingly matters in production: What exactly did the agent do, why did it do it, how much did it cost, and what happened afterward?
The emerging approach is broader than a traditional monitoring dashboard. It combines tracing, evaluation, profiling and control to make autonomous systems easier to debug, optimize and operate safely.
As agent autonomy increases, observability is likely to become a standard layer of the AI agent stack rather than an optional developer feature.